by ARNE BATTERMANN
This section describes the sequence of operations for building up a GIS for the Al Koura district. Later on, the GIS data is used as source for hydraulic models in EPANET. The necessary steps included:
by STEFFEN MACKE
Though the GIS software used should not be too important when creating a GIS, a few words are necessary to line out the alternatives in this case. As DORSCH Consult Amman and the Water Authority of Jordan use GIS software from ESRI, it was natural to choose ESRI software.
ArcInfo is ESRI's high end GIS system. The multitude of programs alone is confusing:
The traditional command line oriented flavor of ArcInfo. Useful mostly for GIS experts, as the command line appears very cryptic to end-users.
A modern, Windows NT based version of ArcInfo.
The three core applications are:
ArcView is also a powerful GIS software but targeted at the low-end market. As there is a lot of functionality missing in ArcView, additional software packages, so called 'Extensions' are often required while working with ArcView. Nevertheless, ArcView is suited for a lot of applications in the water utility sector.
The first step to establish a GIS is to create a database design.
This becomes clear with the current number of ![]() 5400 records
in the updated water distribution network. Each record has several
attributes (fields). As a consequence the number of 5400 is increasing
with a multiplier resulting from the amount of attributes.
5400 records
in the updated water distribution network. Each record has several
attributes (fields). As a consequence the number of 5400 is increasing
with a multiplier resulting from the amount of attributes.
Existing database designs for Amman and Taiz, Yemen lacked several required features, some inconsistencies would have made it extremely complicated to extend these designs.
by STEFFEN MACKE
A water utility GIS typically targeted at several user groups:
by STEFFEN MACKE
GIS software as well as other databases allows the elaborate specification of data types for the attribute fields. Nevertheless when it comes to converting data from one format to another, the conversion process often imposes restraints on the data types used. This is especially true for the conversion process between an ArcInfo geodatabase and ArcView's default data format, the shapefile.
It was therefore practical to limit the number of data types used in the database design to the following:
by STEFFEN MACKE
UML, the Unified Modeling Language is a standard developed by the Object Management Group (OMG). ``The Unified Modeling Language (UML) is a language for specifying, visualizing, constructing, and documenting the artifacts of software systems, as well as for business modeling and other non-software systems. The UML represents a collection of best engineering practices that have proven successful in the modeling of large and complex systems.''[7] The OMG web site5 contains more information on UML.
UML has become an industry standard for CASE (Computed Aided Software Engineering) tools. CASE tools allow structuring the often chaotic software development process in a way that it becomes transparent. UML is well suited for modern, object-oriented data models.
UML is quite complex, for example it defines the following diagrams:
Independent of any programming language or other software involved in the development process, UML allows to create standardized visual representations of data models. Such diagrams can serve as a discussion basis for developers as well as non-developers involved in the design process.
A number of applications allow UML modeling, Microsoft Visio is probably the most prominent one. Also Visio serves as a UML CASE tool for ArcInfo.
For the present Al Koura GIS database design, dia6 was chosen as the UML application. Being a free diagram creation software makes dia the first choice not only for UML diagrams.
Like Visio, dia is very extensible. The file format used by dia is XML (eXtensible Markup Language), an industry standard, that is very easy to convert to other file formats.
During the project it was possible to show with proof-of-concept applications that it is possible to load UML class diagrams created in dia to ArcView. Creating SQL tables with such models is also easy. Hopefully these concepts will evolve into practical solutions the future.
Class diagrams are also known as ``static state analysis diagrams'' or ``static structural diagrams''. The following will only describe class diagrams composed of two elements: Classes and generalizations.
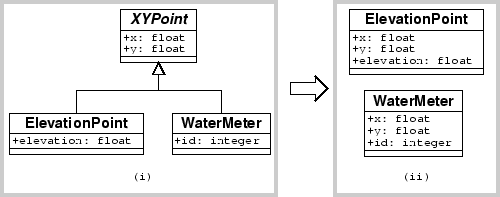
Classes describe objects with similar structure. In the diagram a class is represented by a three-compartment box, with the upper compartment containing the class name. The middle compartment contains a description of the class attributes. The lower compartment is used to describe the methods of a class. Methods are not used in following; the class diagrams of the thesis will only contain classes with empty lower compartments. In such cases the UML software usually allows to switch off the lower compartment in order to create a visually more appealing representation. However, in the following the third compartment is displayed in order to be compliant with the UML standard.
Classes are separated into abstract and non-abstract classes. The difference between them is that abstract classes only exist in the UML model. Non-abstract classes not only exist in the UML model but also in the data itself: They are visible as files or database tables, for example. To reflect the difference, the name of abstract classes is displayed in italics in the diagram.
Generalizations are used to model the relationship between a more general element (parent) and a more specific element (child). The child inherits all attributes and methods from the parent.
In the diagram a generalization is represented by a line that stretches from the parent to the child. The parent's end of the line is marked by a large hollow triangle.
Figure 19 explains how UML class diagrams with generalizations should be read:
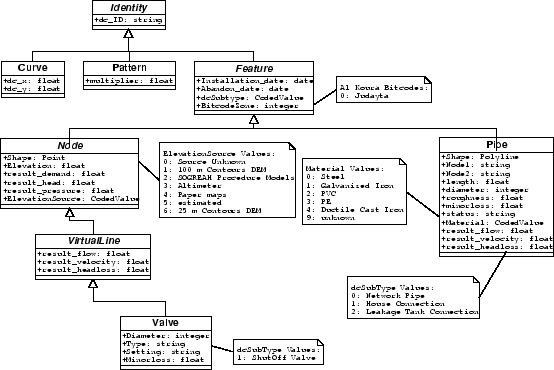
Appendix 15 contains the structure of the database. Taking the pipes as an example, the UML class diagram will be explained (figure 20):
Together with the Node class the Pipe class shares the attributes of the Feature class, which consists of 4 attributes. The superclass of the Feature Class is the Identity Class. This class contains the most general element dc_ID. The attributes of Identity are inherited by the classes Curve, Pattern and Feature. As a consequence the Pipe class consists of 17 attributes like 'dc_ID', for an identification of each record, 'Installation_date' for a documentation of age of the pipe or 'length' for the length of the pipe.
In some cases notes are linked to the attributes of a class. These notes contain domains and further define valid attribute values. They are implemented as coded value domains in the GIS. The sense of these domains is to restrict the input into a record to a defined input and to offer the opportunity to make queries for parts of the network.
As an example the following pipe theme query will select only network pipes.
dcsubtype = 0
Similar to this example any kind of object of the water distribution network can be selected by queries, with a database structure shown in appendix 15.
Properties of attributes like different pipe materials under 'Material' can be defined as giving each kind of material a characteristic number.
In the same way the attributes of all other elements of the water network are described in the diagram. The difference between pipes and the other elements is the geometry of the class. While pipes are polylines all the other spatial classes (junctions, tanks, pumps, valves and reservoirs) are points and therefore these feature classes share the properties of the Node class.
One of the most important parts of GIS work is the quality control functionality. A lot of time can be saved by using the quality-checking tools offered in GIS packages like ArcInfo. Very often digital maps are going to and fro between GIS operators and engineers. If the proper quality checks are missing in this process, time and money are wasted.
The integration of quality control tools into the process of creating and updating digital maps can yield many advantages for the company and the employees, such as:
Domains have been used to ensure data quality.
These domains are limiting the inputs into a field of a record to defined values. Pipe materials for example can be defined in a coded value domain. Each material can be coded with a specific number as shown in figure 20. After integration of a domain like this inputs, which are not equal to one of the defined codes, are not accepted.
The advantage of limitations in the input into attributes of the database consists of keeping the records clear. Spelling errors or impossible materials for example can be excluded like this. Moreover the size of the database is decreasing because number-fields are usually smaller than strings. As a consequence the database is getting faster and does not require as much hard disc space as the equivalent database without coded values.
Are used for reducing the probability of entering values that are out of a defined range. Also in this case an example can be found in the pipe theme of the created database structure. For excluding mistakes by entering pipe diameters a range is defined between 0 and 500. With a defined range like this it is fixed that pipes below 0 and above 500 do not exist.
Because of the small leakage pipes the lower limit is defined with 0. Over validity checks in ArcInfo all records of the database are selected automatically, which violate the defined range domains.
In addition to domains other checks have been made for improving the quality of the database. Often GIS maps have their source in CAD drawings. During the digitizing work many mistakes may occur. It might happen that the snapping functions are not focused correctly with the consequence of gaps between elements that should be connected.
Missing intersections are very often the reason for quality loss. For digitizing a connection of one pipe on another one of them has to be intersected, for creating a new junction between the pipes. As mentioned this happens very often because of wrong snapping.
Unnecessary intersections can reduce the quality of the map. Connectivity does not exist anymore, if an intersection is set on a pipe without creating a new junction on this location. Plenty of these mistakes have been present in the network which had to be updated in the scope of this thesis. The most important tool to locate these mistakes has been the Geometric Network of ArcInfo. It allows to check the connectivity of complex networks including pipes, junctions, valves, pumps, tanks and reservoirs.
With setting a so called ``flag'' at one element of the network (junction, pipe, valve, etc.) a trace the can be started in the Geometric Network, which selects all those elements that are connected with the flagged element. For getting an accurate state of the network all selected elements should be marked with a temporary attribute. After un-selecting the elements a query can be started for all those elements, which have not been marked.
The update contains new pipes of the network as well as functional parts like valves, washouts, pumps, tanks, reservoirs, water meters, endcaps, etc. The update includes quality checks for connectivity and automatic validity control of records in defined ranges. The continuous quality control is the key for a good network update. The bulk of work consists of correcting digitizing mistakes.
The quality of the source material of the network has been poor. Zones have not been clear because of missing valves and wrong connections of pipes. Pipes and junctions have sometimes been double at the same location. Quality checks have not been undertaken before handing over the data. Table 6 gives an overview of the quantity of elements added to the network. The table is not reflecting the work connected with updating the network because a great part consists of changing attributes of existing records without adding new records. This is not shown in table 6.
|
With the process of correcting present data app. 13% of the network have been updated. 27 km of pipeline are added and 152 valves are placed in the distribution system. Pump and booster stations as well as the locations of wells are integrated into the network. Reservoirs are integrated for the south of Al Koura. Appendix 19 shows the updated water distribution network of Al Koura.
With handing over the water distribution network the quality checks described in section 6.3 have been passed successfully. The attributes adhere to the domains and the network connectivity is established.
This section describes the steps of checking and integrating the elevations delivered as paper map by the RJGC. The paper maps are digitized and a digital elevation model is build. Interpolation is the key for creating digital maps. The mistake is de- and increasing with the accuracy of the source data. In this case the source consists of 25m-contour paper maps. This means that the maximum mistake can be 25m.
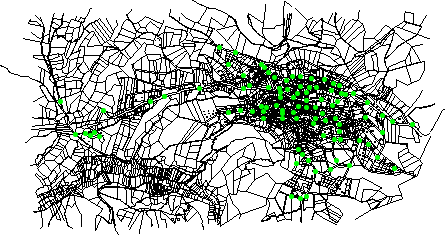
Spot heights are taken for making a cross-check with the delivered data. The spot heights are taken with altimeters 7, which are used differential to get accurate readings. One stationary altimeter is used to correct the atmospheric pressure variation over the time, while the second one is used in the field. The altimeters have an accuracy of ± 5m, before using they are calibrated.
Figure 21 shows the location where spot elevations have been taken with the altimeter.
The quality check consists of the following steps:
The used DEMs have been created from 25 m contours. Between the contours the elevations are interpolated. The DEMs were made for villages or groups of villages separately. For each DEM quality checks are made. For getting an impression how to value the mistakes, the highest and lowest point of each zone is listed in table 7 additionally.
For giving an example of this elevation check, the compared heights between DEM and Altimeter are listed in appendix 16.
|
The integration of the checked DEM is done with the DC Conversion Extension.8 New records in a defined field of a chosen point theme are generated by using the extension. In reliance on the coordinates of points the corresponding grid values are added to the point theme. The elevations of Judayta, Kufr Awan and Kufr Abil are updated. The contours of the centre and northern part of Al Koura have not been bought as DEM yet and consists of elevations taken from a DEM that is based on a 100 m contours.
No matter which area of Al Koura, each point of the point themes got an elevation. The source of elevation is documented for each record in the field 'ElevationSource` as illustrated in appendix 13.
by STEFFEN MACKE
The hydraulic simulation of water distribution network is a complex task. For hilly areas a discussion of such simulation models is only possible with the knowledge of the topography.
Modern information technology allows visualizing digital elevation models in real time.
Such Visualization tools are the ideal companions to powerful network analysis software - the integration of hydraulic modeling software into the GIS will even allow the integration of network analysis and three-dimensional visualization.
The GIS created for Al Koura contains the data to create three-dimensional visualizations. Without further processing, however, the resulting representations, called scenes, will look odd.
An appealing 3D-Visualization requires several steps: