= 4.58
by STEFFEN MACKE
A lot of problems with the water supply network in Judayta village are obvious even without an hydraulic analysis. The extremely high pressure in the lower supply areas is likely to cause a lot of damage to the expensive water meters as well as leakage.
To compare the current leakage rates in the Judayta network, the specific characteristic loss can be used. The specific characteristic loss relates the leakage to the supply time and length of the water network. Table 10 displays diameters and lengths of pipelines in the Judayta water network.
As the calculation of the specific characteristic loss does not take house connections into account the total length of water network amounts to 6.23 km. One supply period in Judayta lasts 58 hours in which 1658 cubic metres are unaccounted-for. Hence the specific characteristic loss is:
qv = = 4.58
In the literature, the following specific characteristic loss is given as a high value for underground containing seams[8]:

It is very important to realize that most of the actions described hereafter only have a chance to succeed if the administrative actions succeed also. The administrative measures are a precondition for the technical ones.
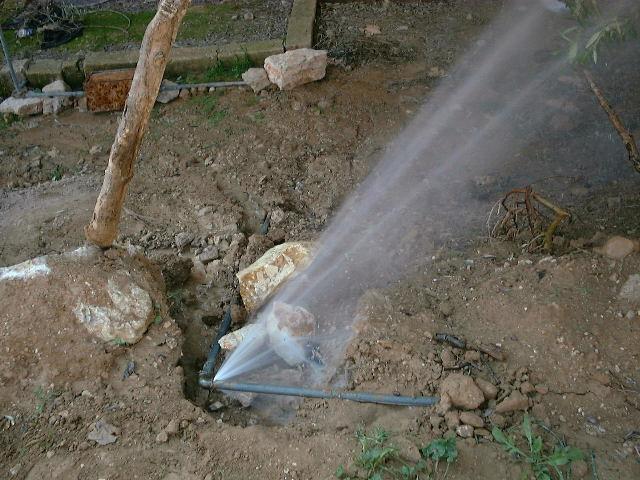
As there are many leaks visible in Judayta (figure 55 shows an example), a technical loss reduction program is likely to succeed. But the decision on technical actions like a leak detection campaign should be delayed until more reliable meter readings are available for both the customer side and Judayta pumping station.
Technicians reported that the Judayta pumping station is ``one of the best'' throughout Irbid Governorate - in terms of leakage and operation. However the following practical improvements can be made with only little effort.
One of the most important actions to be taken is the installation of the necessary bulk water meters in Judayta pumping station. The current setup does not allow to record the consumption of the villages properly: The unmetered back flow into the well as well as additional overflow - which is also unmetered, make it impossible to calculate a reliable water balance (appendix 18).
In addition, the current records rely on the operator at the pumping station: He has to record the supplied village together with the well production readings - a process that is very likely to produce unnecessary errors.
The introduction of separate meters for the two pumping directions should also be used to move the valves that operate the pipelines into the pumping station: Currently they are located right in front of it. It should be evaluated whether it is more practical to move the fence or to move the valves.
Only those new bulk meters will allow an accurate assessment of tank overflow and back flow to the well.
Water meters capable of operation under a pressure of 40 bar are expensive, the water meters should therefore be installed between storage tank and pumps. However this will still allow the operator to pump with the same set of pumps into different directions.
Alternatively, the meters could be installed on a higher location in the network - such a setup is not recommended as it would not allow to meter water losses on the way from the pumping station to the meter location. Also a water meter located within the pumping station grounds is more secure than other locations. An incident during the logging campaign illustrates this: A logger was set on fire.
Currently the back flow from the tank to the well decreases the well pumping efficiency by up to 11% (section 5.1). The main problem is that the overflow takes place in a way that is hardly noticeable by the operator: The noise of the pumps does not allow to hear the water overflowing.
An automated pump control is not likely to succeed, as it would require proper maintenance, which can not be guaranteed under the current circumstances.
The following actions could be used overcome the problem:
As the horn is much cheaper than the tank it should be installed first to avoid a costly bad investment with the tank: With horn the operator has a chance to minimize the overflow. The additional water meters will allow the supervision of the operator.
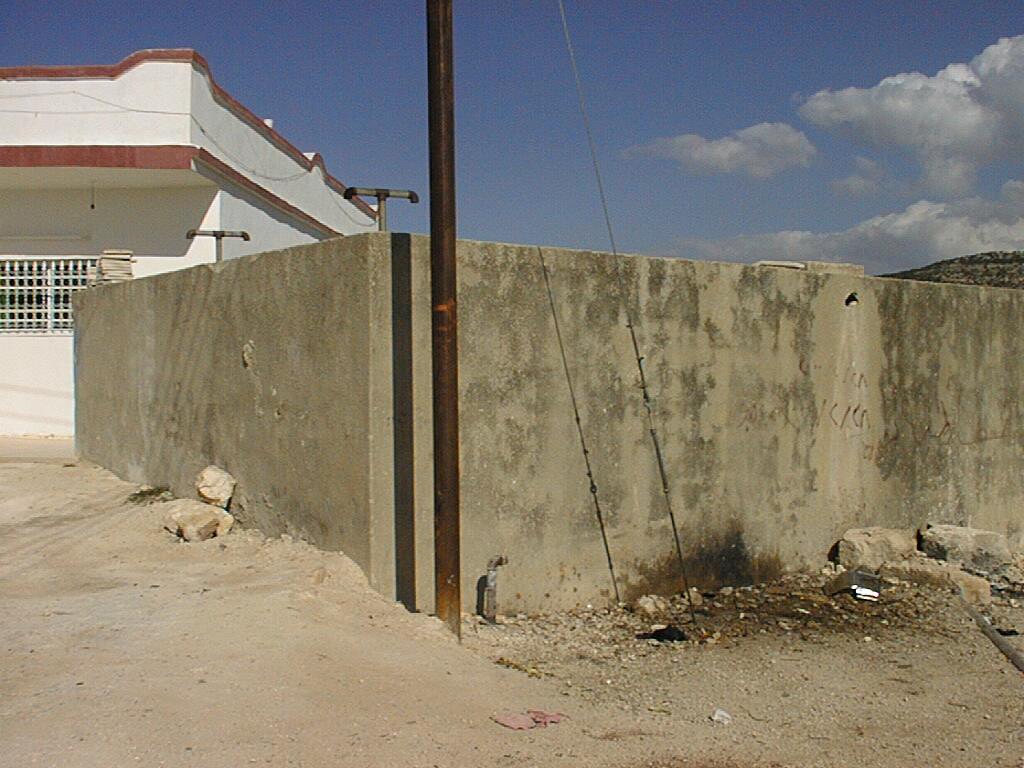
The existing (but currently unused) reservoir with a capacity of 200 cubic metres that was discovered during the altimeter survey makes it possible to change the mode of operation from intermittent to a continuous supply of water. Figure 56 shows a photo of the reservoir.
Again, such an action is only likely to succeed if administrative actions take place before: The intermittent supply is currently used as a rationing system that prevents excessive illegal consumption by only providing water one or two days a week. Continuous supply would allow the illegal consumers to waste more water.
Under the assumption that the privatization of the meter readings succeeds and reduces the illegal consumption, the intermittent supply rationing could be abandoned.
The capacity of the reservoir is big enough to provide the average demand for 9 hours. This should be sufficient as the household storage tanks will not be abandoned immediately and hence the demand curve will be relatively flat.
The existing Reservoir is not able supply the whole village because it does not supply sufficient pressure. By establishing a booster station next to the reservoir this problem could be solved.
In case the empty parcel next to the reservoir is not available for the booster station, the installation of pumps on top of the reservoir can be evaluated as well as submersible pumps in the reservoir.
The booster station will also allow to serve additional customers in the north-eastern part of the village which can not be supplied currently - the pipelines are already in place in this area.
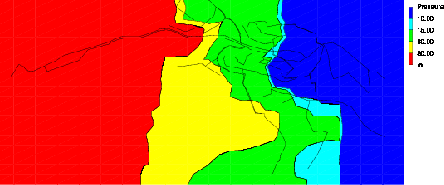
According to table 8, the average consumption of Judayta village was 2865 cubic metres per week in the 2000 reading cycle. Assuming 30% UFW for the future (section 9.7), this yields a total demand of 6.16 litres per second for continuous supply. A simple network model based on reservoir supply and the demand has been created.
Figure 57 shows a map containing the network pressures distribution obtained from the network simulation model. The areas of pressures below 15 m in the west of the village need to be supplied by the booster.
The re-use of the existing reservoir will reduce the pressure in the network. For example, the peak pressure at the eastern village boundary - the most problematic area - will drop from above 30 bar to approximately 20 bar. As the pressure influences leakage over-proportional (equation 2, section 7.3) the pressure reduction will reduce the amount leakage accordingly.
The decision whether to use a pressure reduction valve (PRV) or not is a difficult one. One the one hand, the huge elevation differences in the Judayta network require different pressure zones, on the other hand, such valves are expensive and need appropriate maintenance in order to function properly.
Orifice plates should be evaluated as alternatives to pressure reduction valves -their advantage is that they are inexpensive. However they are not able to reduce static network pressures and may therefore not be well suited for Judayta's lower supply zones.
Though pressure reduction valves or orifice plates may help to reduce the critical network pressures further, the decision whether to use them or not should only be taken after intensive evaluation together with the personnel in charge - it is inevitable that they support the ideas and have the knowledge maintain the installations.
The cost rating is based on a cost estimate in [5]. The unit rates are based on recently completed contracts in Irbid governorate.
|
Only one pump is considered, as it is still possible to pump directly into the network in case of a booster pump failure.
Some of the benefits from the described actions can not be expressed in monetary terms - for example the continuous supply of water, the possibility to serve additional customers or the ability to obtain reliable flow measurements.
Similar pressure reduction measures in another village of the Al Koura district - namely the Al Taibeh System - are expected to yield a reduction of the unaccounted-for water figures from 50% to 30%[5]. Assuming the same increase in efficiency for Judayta, it would be possible to increase the revenue from water by 20%.
The average revenue for water in rural areas is 0.140 JOD per cubic metre[5]. The estimated surplus revenue is:
This indicates a pay back period of 10 years. For the example in [5] the pay back period was less than two years - due to a reduction in pumping costs. For the proposed actions the pumping costs will also decrease slightly due to the reduced back flow to the well - this is not yet considered.
As Judayta pumping station also supplies other villages, it is likely that the cost benefit analysis will improve if similar actions are taken for the remaining villages.